
Event Ops Analytics Engine
Replaced a 100-row spreadsheet ritual with a live analytics platform. Built solo in four days.
- Org
- BI Worldwide
- Role
- Design, Build & Strategy
- Timeframe
- 2025
- Tools
- Figma, VS Code, GitHub Copilot, ChatGPT
The Challenge
Great events. Exhausted people. Terrible data.
- pages per report
- 3
- rows to fill
- 100+
- silo per event
- 1
Event ops comes home from twelve-hour days and gets handed a spreadsheet to fill from memory. So reports came back missing or wrong, and “how did our events go this year?” meant days of manual aggregation.
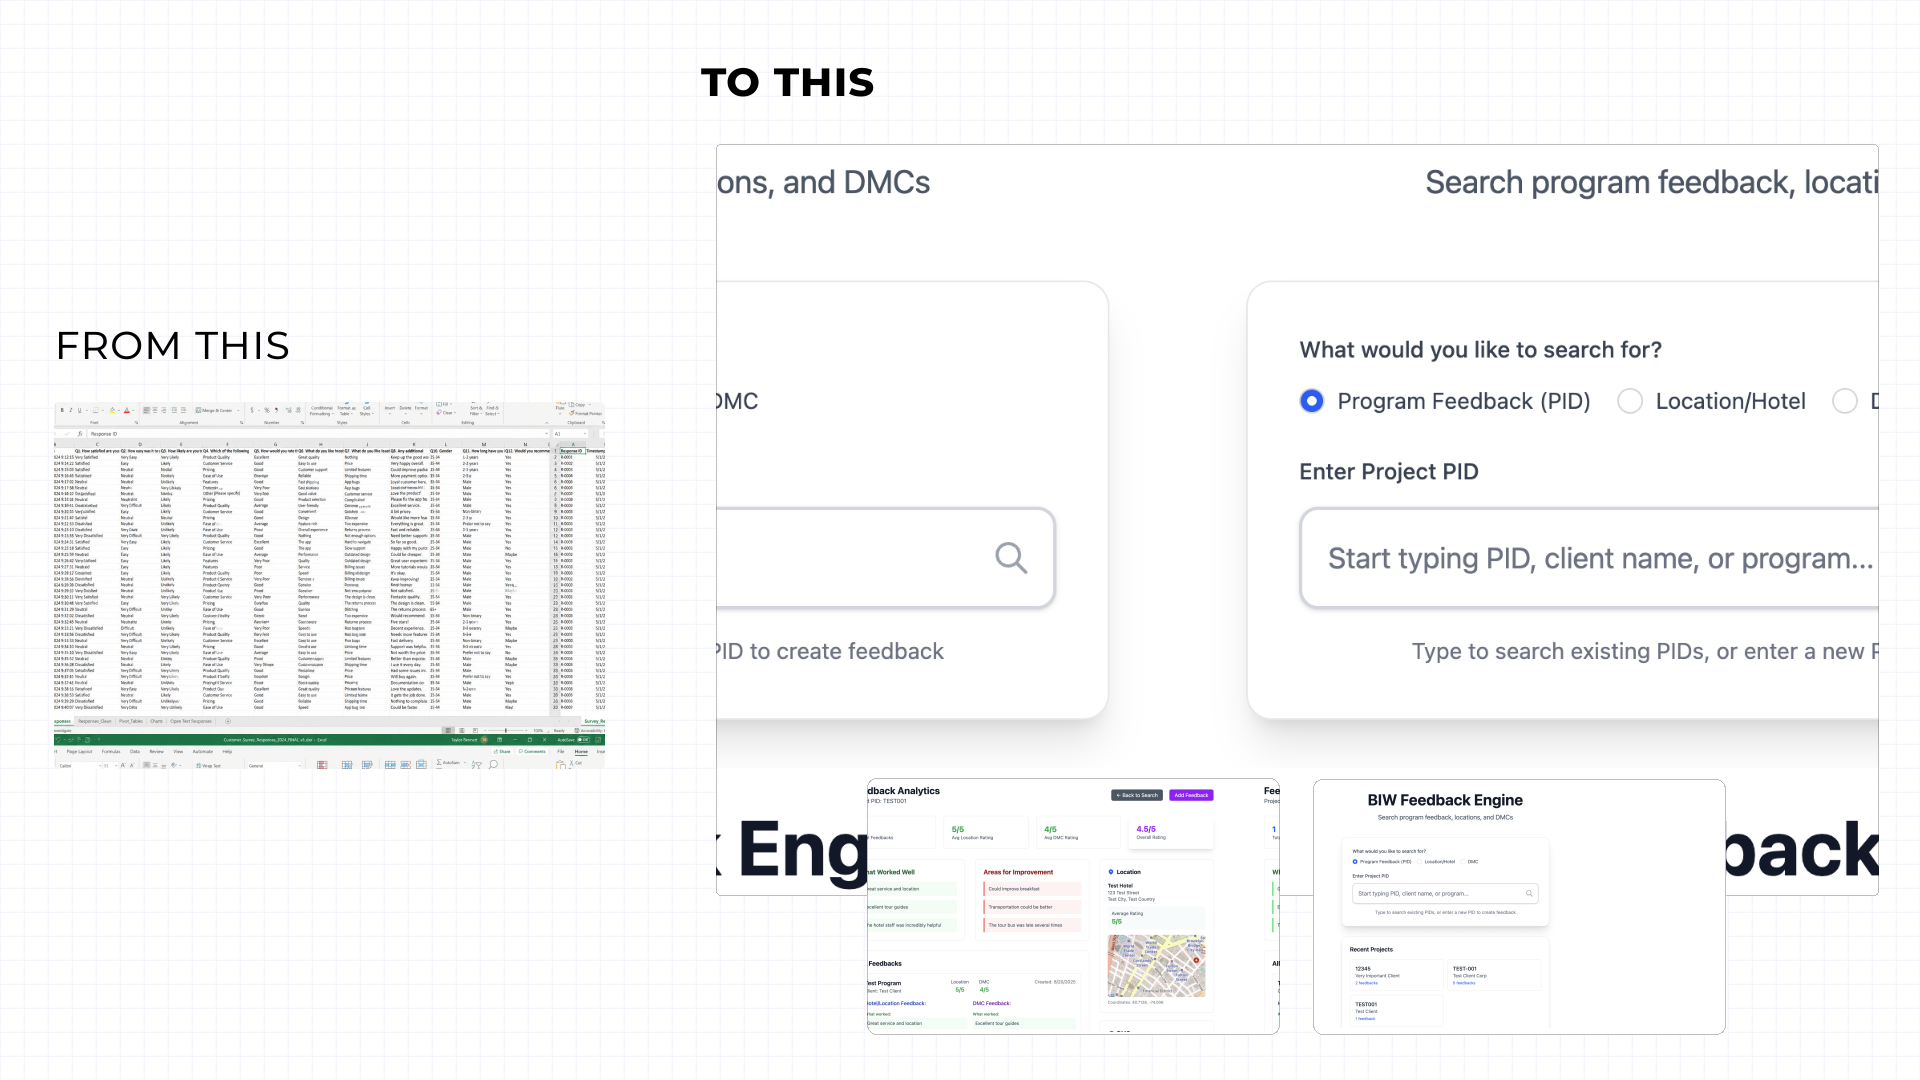
From scattered excel spreadsheets to a unified feedback analytics platform.
The Brief
I was called in to help with AI prompting.
The idea on the table: have the team dictate a recap into Copilot, then paste the transcript into the spreadsheet. I was asked to make that work.
The Approach
The prompt wasn’t the problem.
- Dictation still ends at the spreadsheet
- Someone still splits a transcript into 100 rows
- The silos don’t move an inch
So I proposed killing the spreadsheet instead: a short mobile survey per event, filled out on site while it’s fresh. A vendor cancels mid-setup, you log it from your phone in ten seconds. Everything lands in one central database.
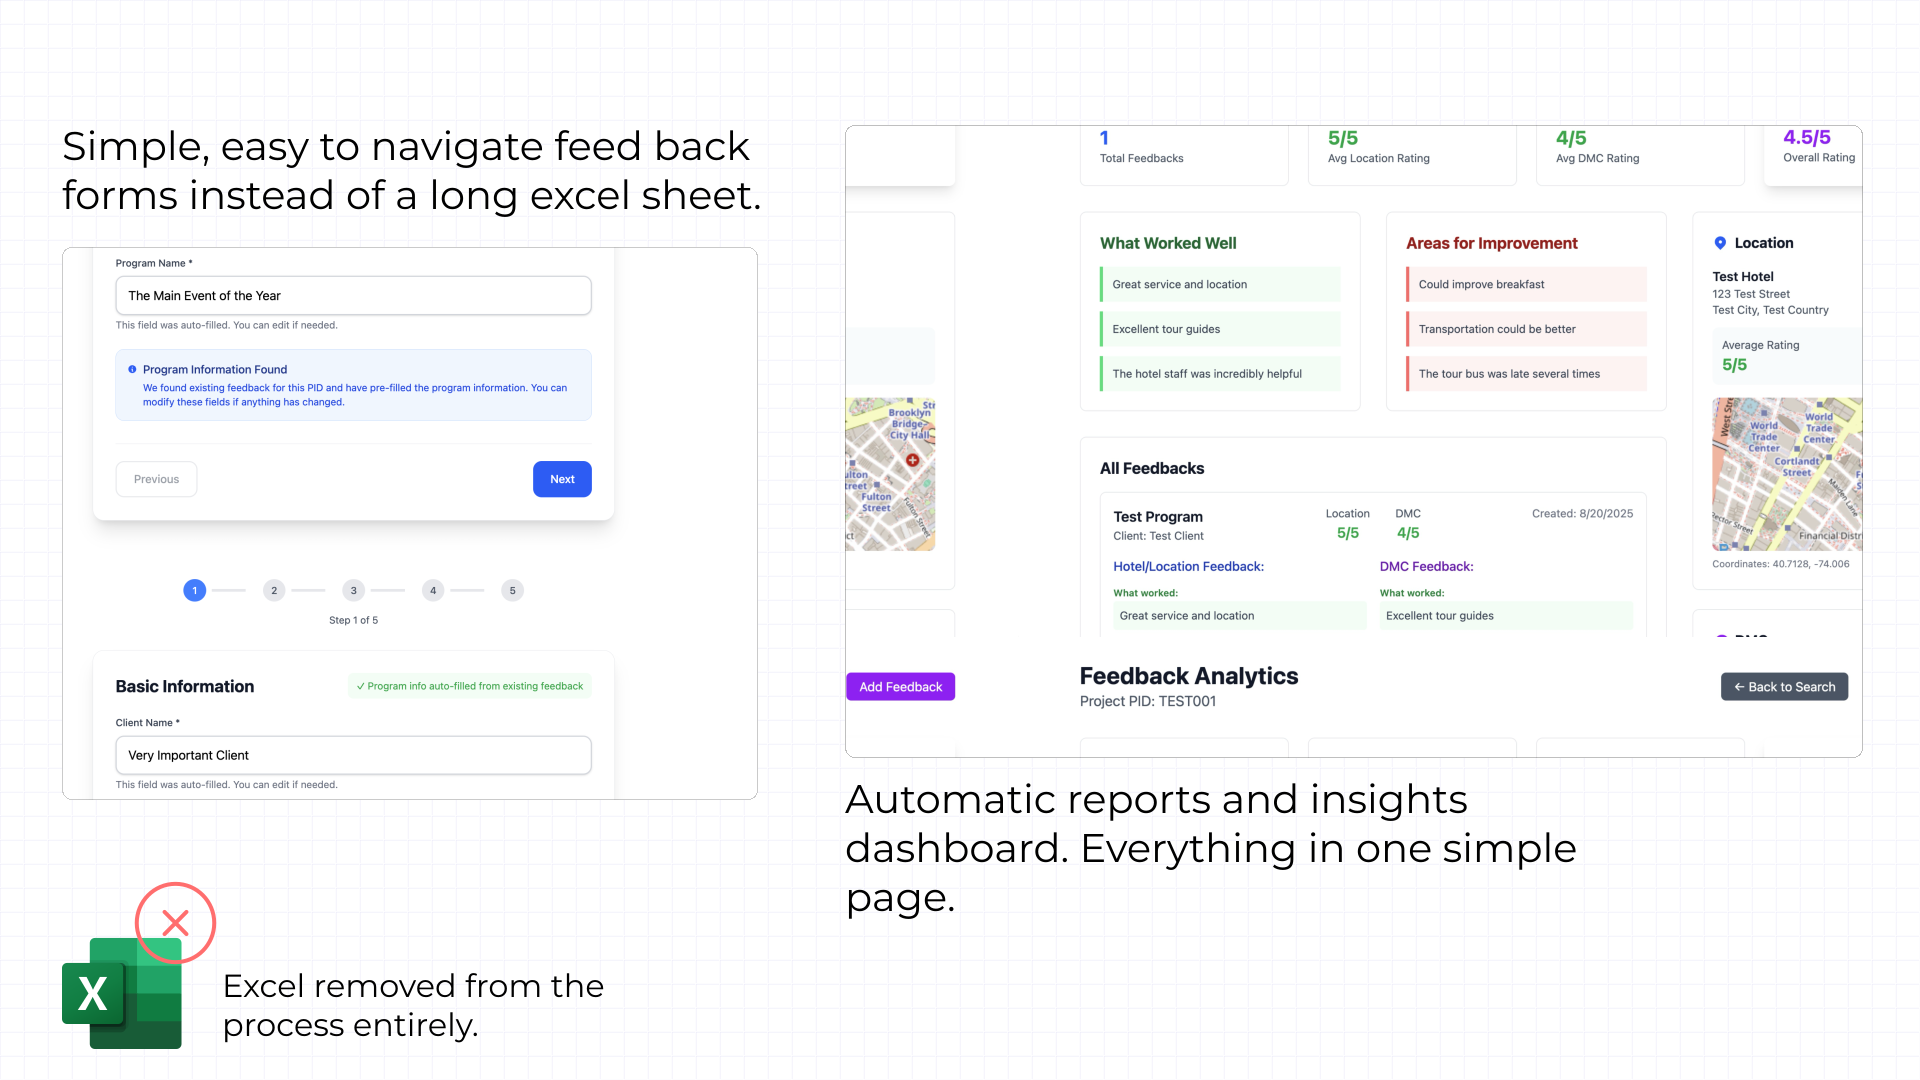
Ditched Excel completely, replaced it with a form for data collection and an analytics dashboard for the insights.
The Outcome
The estimate was eight weeks and two teams.
- days to deliver
- 4
- person
- 1
- to log an incident on site
- 10s
BIW got a queryable record of every event, plus a bird’s-eye view of every venue and vendor, usable by any team. Leadership committed resources to carry it forward after my internship ended.